Page 6 - Annual Report 2015 EN
P. 6
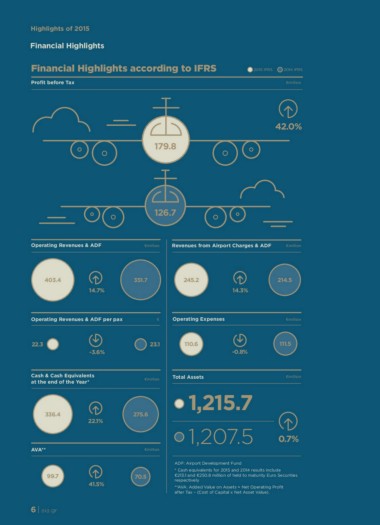
Highlights of 2015 2015 IFRS 2014 IFRS
€million
Financial Highlights
Financial Highlights according to IFRS
Profit before Tax
42.0%
179.8
126.7
Operating Revenues & ADF €million Revenues from Airport Charges & ADF €million
403.4 351.7 245.2 214.5
14.7% 14.3%
Operating Revenues & ADF per pax € Operating Expenses €million
22.3 23.1 110.6 111.5
-3.6% -0.8%
Cash & Cash Equivalents €million Total Assets €million
at the end of the Year*
275.6 1,215.7 0.7%
336.4 22.1% 1,207.5
AVA** 41.5% €million
ADF: Airport Development Fund
99.7 70.5
* Cash equivalents for 2015 and 2014 results include
6 | aia.gr €213.1 and €250.8 million of held to maturity Euro Securities
respectively
**AVA: Added Value on Assets = Net Operating Profit
after Tax – (Cost of Capital x Net Asset Value).