Page 6 - Annual Report 2013
P. 6
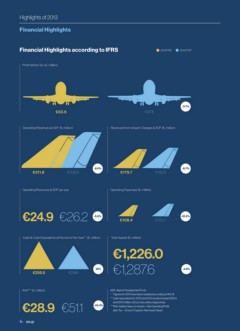
Highlights of 2013
Financial Highlights
Financial Highlights according to IFRS 2013 IFRS 2012 IFRS*
Profit before Tax (€, million)
-3.7%
€93.9 €97.5
Operating Revenues & ADF (€, million) Revenues from Airport Charges & ADF (€, million)
-8.0% -6.7%
€311.8 €338.8 €179.7 €192.6
Operating Revenues & ADF per pax Operating Expenses (€, million)
€24.9 €26.2 -5.0% €108.4 €120.7 -10.2%
Cash & Cash Equivalents at the end of the Year** (€, million) Total Assets (€, million)
€1,226.0
19% €1,287.6 -4.8%
€255.5 €214.6
AVA*** (€, million) ADF: Airport Development Fund
* Figures for 2012 have been restated according to IAS 19
** Cash equivalents for 2013 and 2012 results include €220.5
€28.9 €51.1 -43.4% ***AVA: Added Value on Assets = Net Operating Profit
and €201.1million of Euro Securities respectively
after Tax – (Cost of Capital x Net Asset Value)
6 / aia.gr